
Happy 2026 to the AsyncAPI community!
Starting the new year by looking back at our community’s growth. Let’s review the numbers to see our progress, where we can do better, and how we can improve. These metrics help us understand our impact and guide us in the direction to take when working towards the community goals.
For the past achievements, please read the previous Project Status updates.
As a disclaimer, all analytics you’ll read here are collected from the 1st of January 2025 to the 30th of December 2025.
Slack
The AsyncAPI Slack workspace is our primary channel for most communications and updates, where contributors and adopters join to collaborate with others, understand how we work as a community, and chat with maintainers of the specifications and tooling.
In 2025, we welcomed 1857 new joiners and have a total of 7964 members.
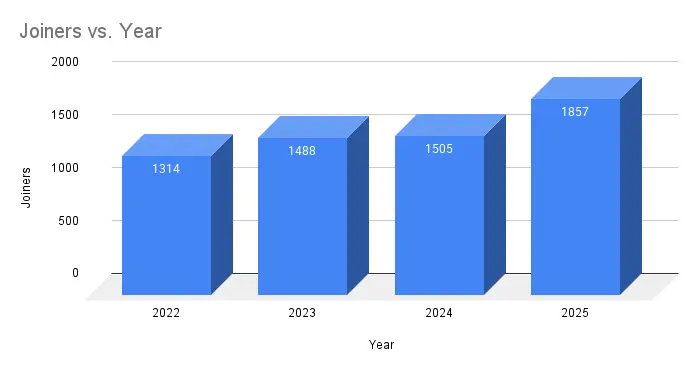
New members on Slack each year.
Our weekly activity reduced by 19% this year, with the intention of reducing noise in channels by disabling some workflow notifications and pausing certain channels. Also, we ran one mentorship program instead of multiple as we did in previous years, and had fewer active working groups.
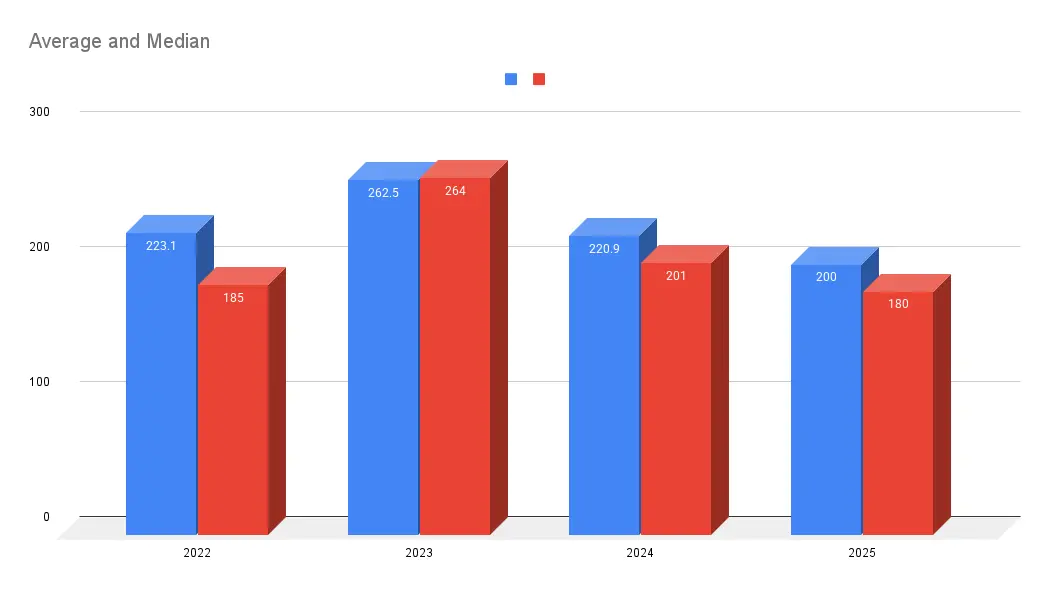
Weekly Slack activity over the years.
Social Media
Our social media platforms help us to share community news, updates, and announcements. We don’t use any premium or paid marketing, and we only maintain LinkedIn, X/Twitter, Mastodon, and YouTube platforms. We use Buffer to publish and manage content across social media.
Buffer
We began using Buffer in July 2024 and switched to paid services in September. This gave us more tools to track and report on our social media management. The analytics below cover LinkedIn and X/Twitter, which Buffer currently supports.
We also have some analytics recorded dating back to 2023.
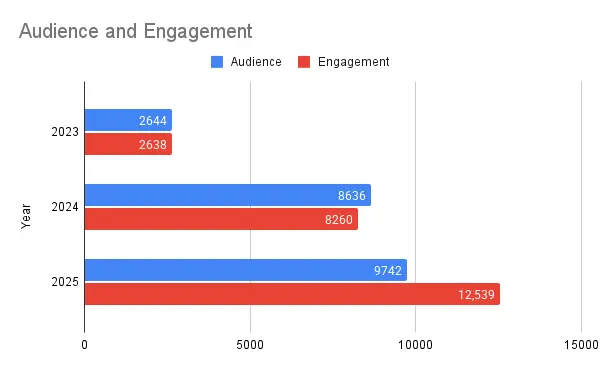
Audience and Engagement analytics from Buffer.
We gained 945 followers on LinkedIn in 2025, bringing our overall following to 4928.
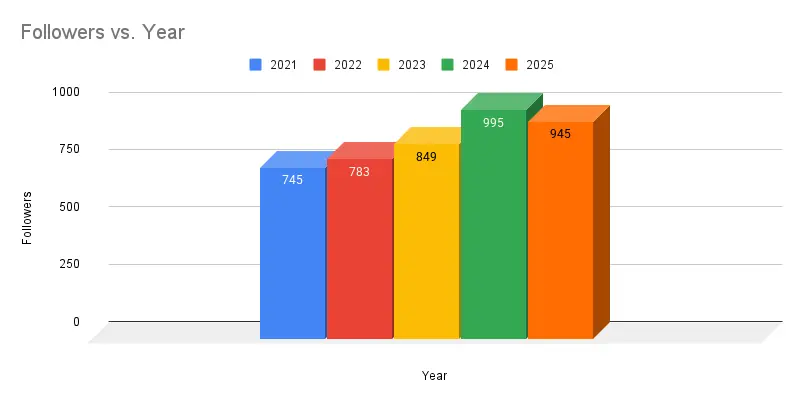
Yearly followers on LinkedIn.
YouTube
We had 272 new subscribers to our YouTube channel this year, bringing our total subscribers to 1,983. While our views and watch time dropped by 29% compared to last year, the community continues to grow and engage.
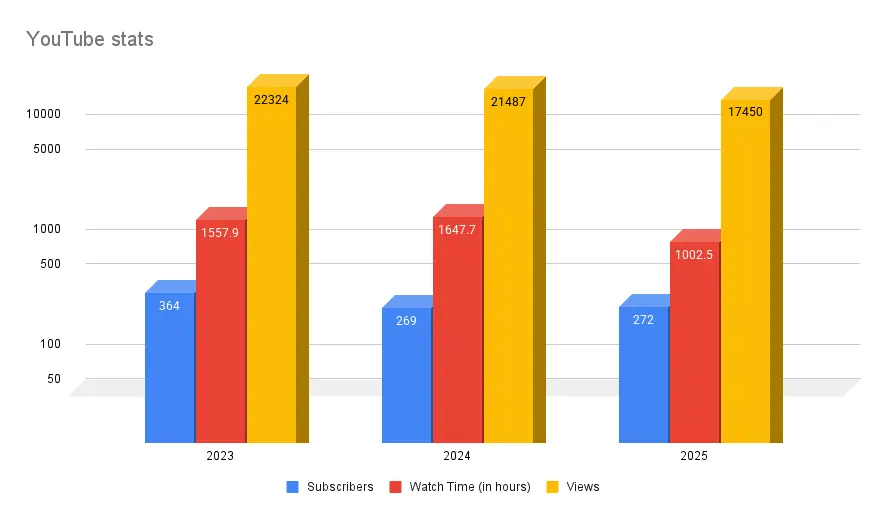
YouTube stats over the last few years.
Newsletter
The community summary newsletter continues to grow and still serves the community as a summary of our monthly blogs, events, and important updates. We sent 10 emails this year, and our average open rate was 41%, while clicks averaged 4.7%. Bringing the overall engagement rate to 22.7%.
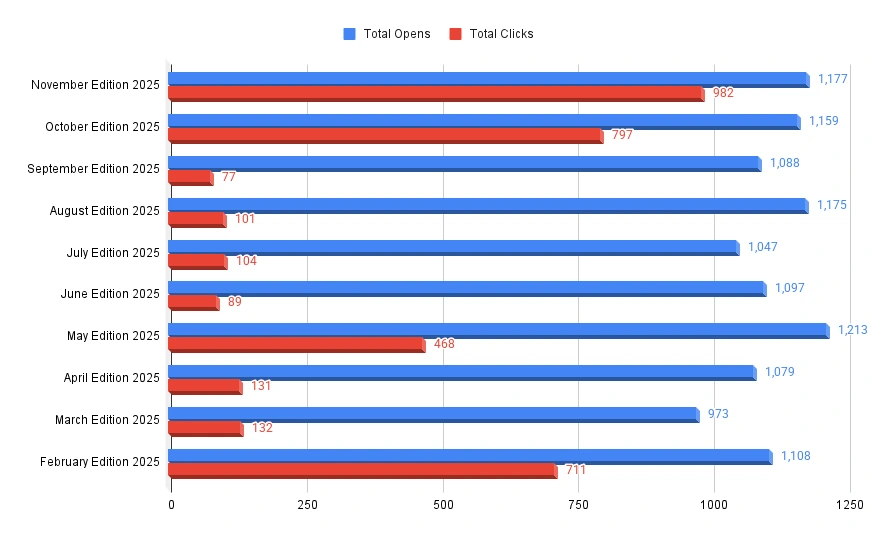
Newsletter Analytics.
The number of new users referred to the AsyncAPI through our monthly newsletter increased, though session time dropped slightly.
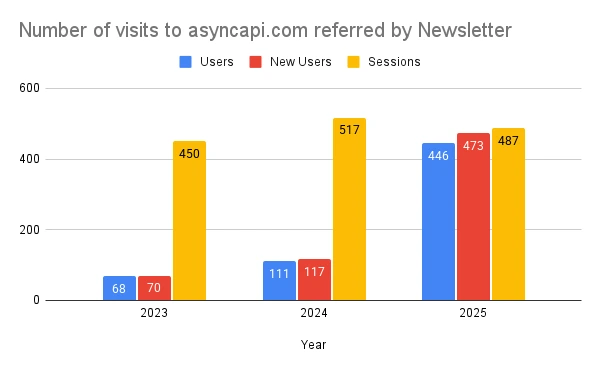
Website visits referred by the Newsletter.
Google Analytics
The overall site performance declined this year, with users by 4.4%, sessions by 9.1%, and pageviews by 15.8%. Docs continue to be a great contributor to the performance in sessions.
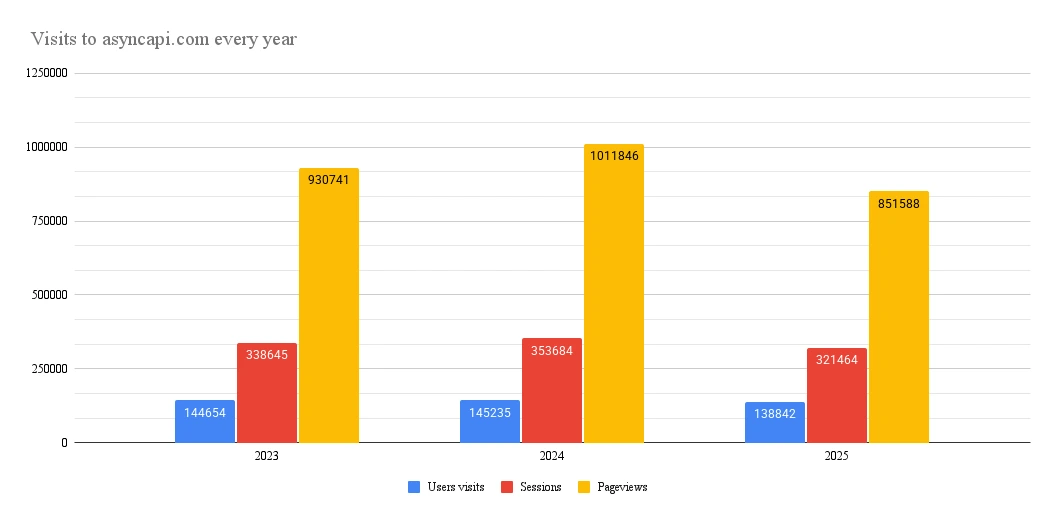
Website visits each year.
The contributing factor leading to the drop in analytics is due to several factors, including users blocking tracking, privacy tools, and browser extensions. This trend affects the traffic recorded, and user behaviour data does not fully reflect the actual audience, as they’re excluded from the analytics reports.
Google Search Console
We saw a 6.9% increase in impressions in Google Search Console, although we had a decrease in clicks.
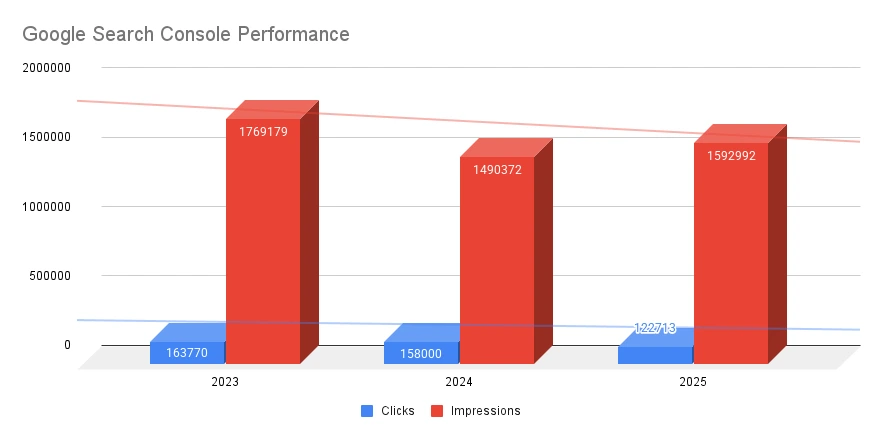
Website analytics from Search Console.
GitHub
We use LF Insights to get detailed analytics for all our repos across the org on GitHub. The community keeps growing, with 1,131 active contributors.
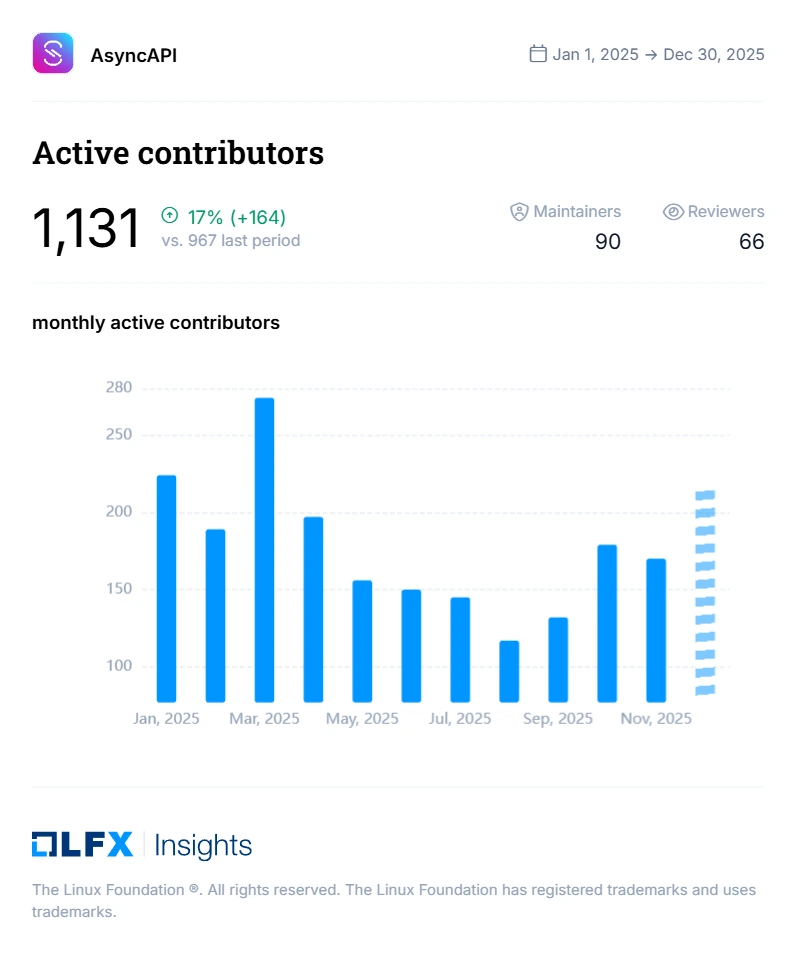
Active contributors on GitHub.
We also improved issue resolution across the project, with the average issue now taking just one month to close, a clear sign of our maintainers' responsiveness.
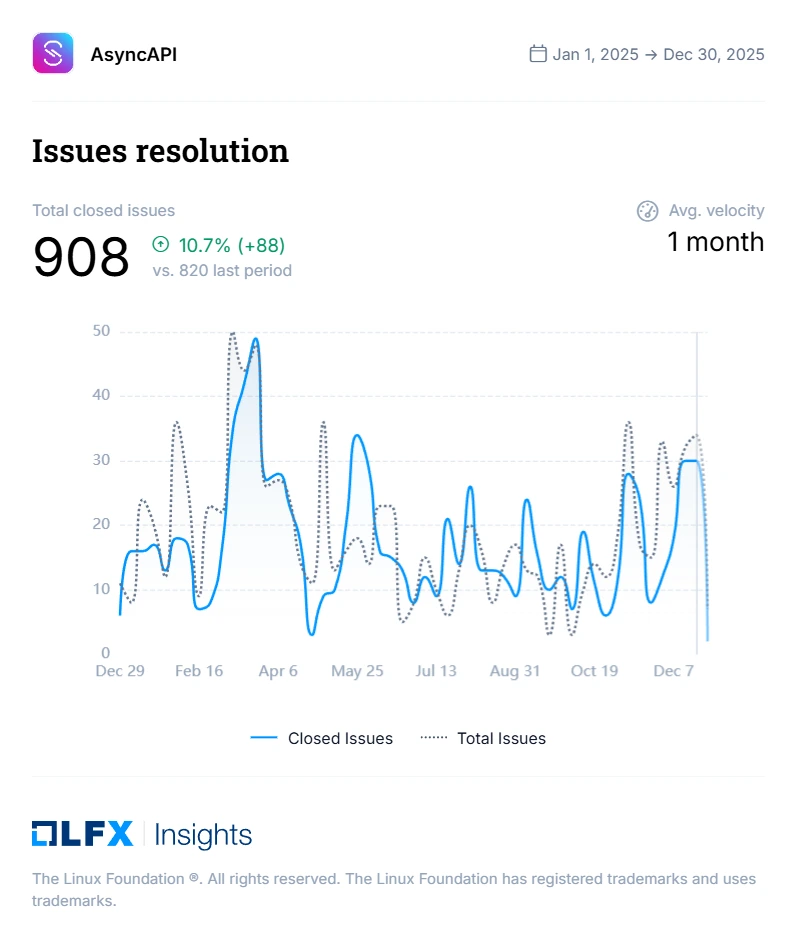
Issue resolution stats.
In the past year, a total of 2,770 pull requests were opened, and 2,390 were merged, highlighting the pace of development and community contributions.
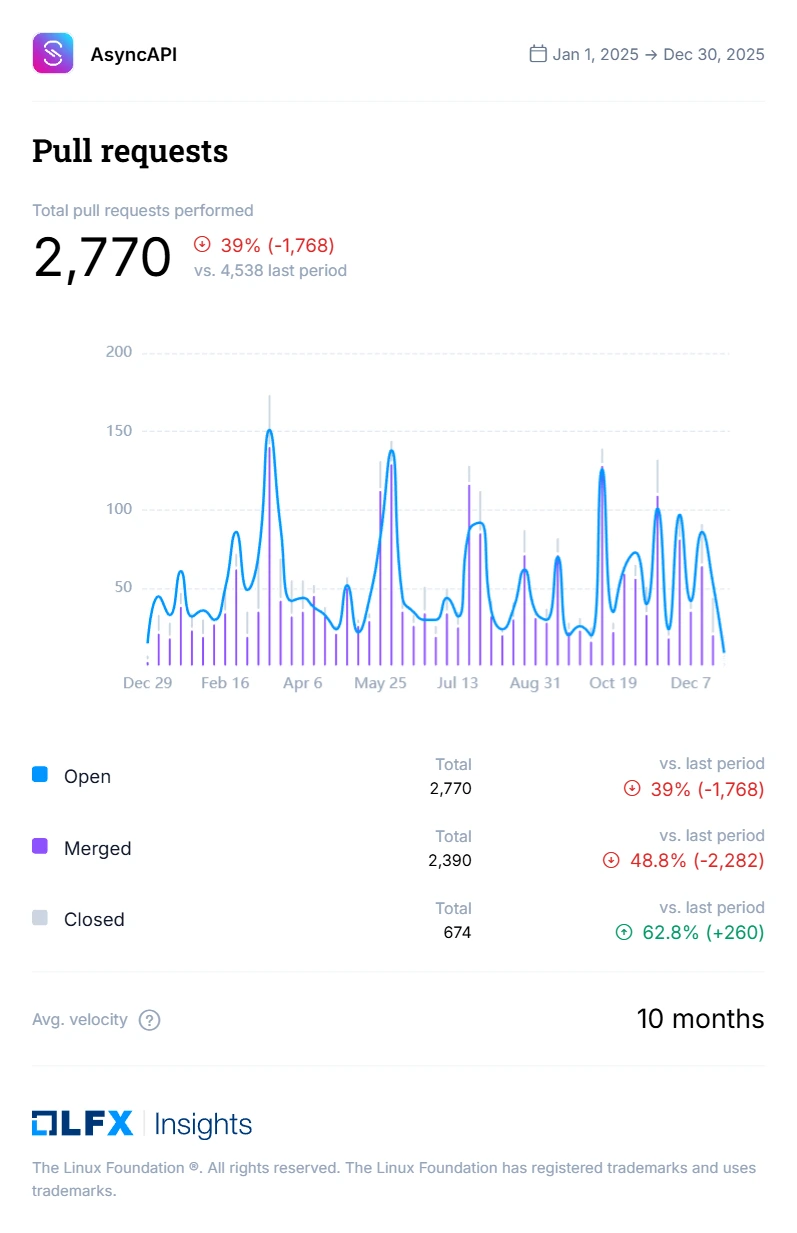
Pull requests resolution stats.
The AsyncAPI community is driven by contributors and maintainers who dedicate their time and expertise outside their regular jobs. Kudos to everyone for your commitment and impact!
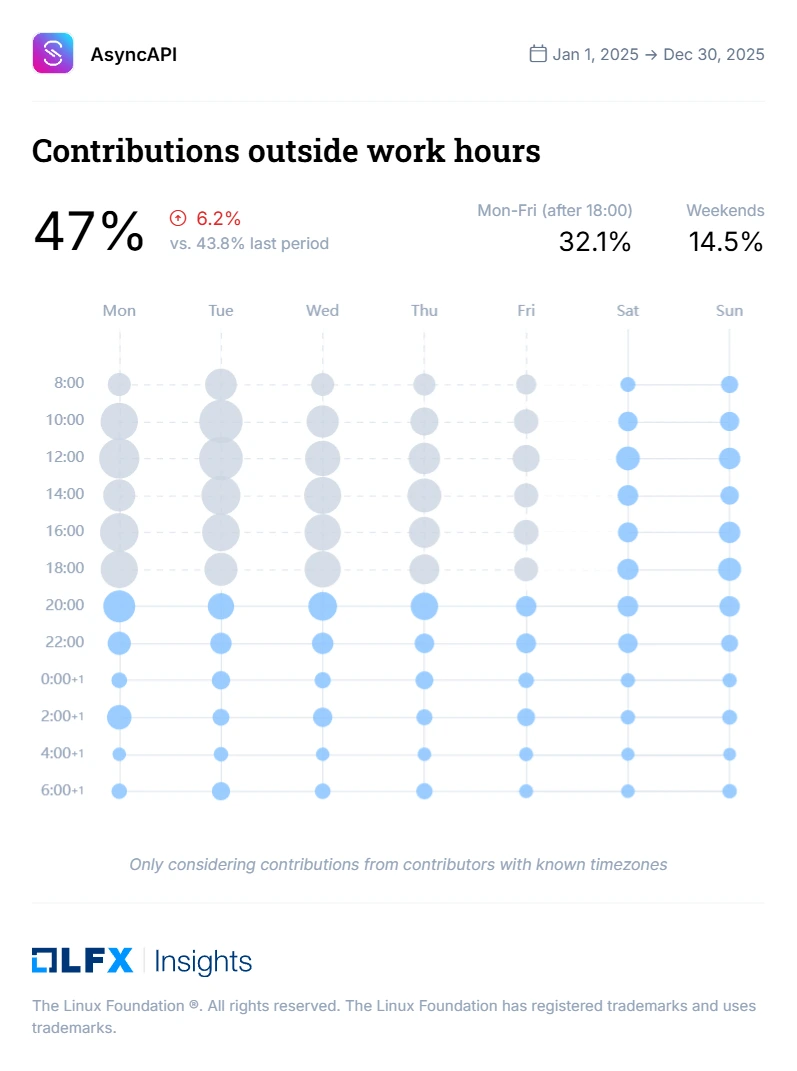
Stats showing contributions made outside work hours.
NPM
AsyncAPI's top packages are hosted under the Node Package Manager. The package downloads continue to increase, and the asyncapi/spec saw 54M downloads in the past year.
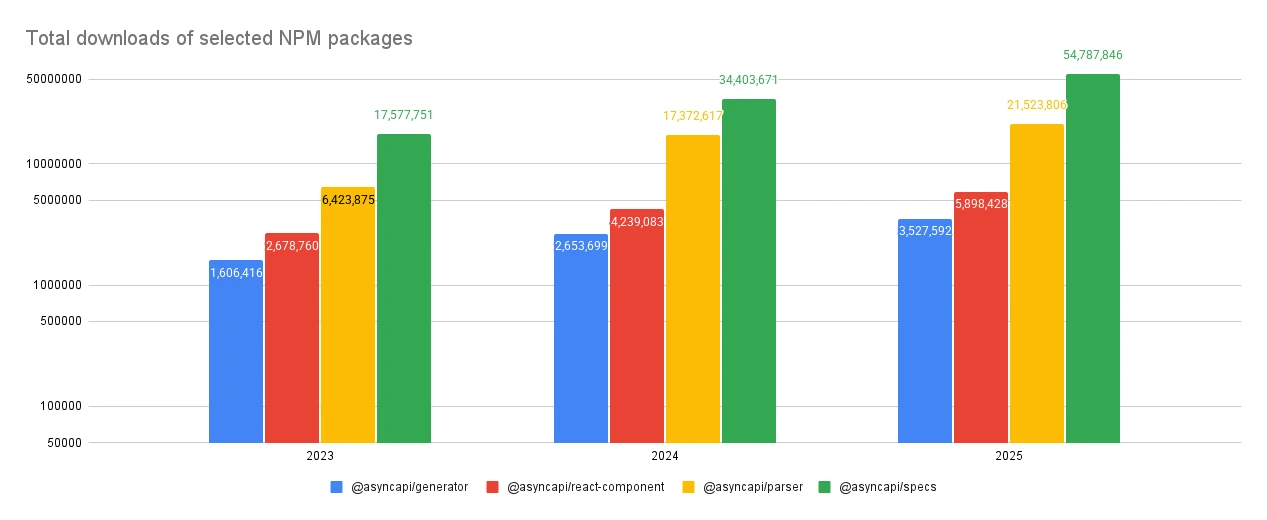
Total downloads of AsyncAPI NPM packages.
Community Achievements
We had so many achievements this year, and here are a few highlights:
- We transitioned and nominated our first Governance Board.
- We published our second case study by TransferGo.
- The AsyncAPI Bounty Program turned 2 with over 36 issues resolved.
- We had six in-person conferences, an online conference, and over 30 speakers.
- Welcomed two ambassadors and introduced monthly meetings.
- Expanded our community docs and content.
- Surpassed 5,000 stars on the Spec repo in GitHub.
These are just a few, but we have so much planned for 2026. Be sure to read the community goals to gain insight into what we will be focusing on.
Image Generated by Nano Banana